Laboratory_6
Lab_6
The data was downloaded from NASA website and within the package of MODIS data, we used MOD13C1 which delineate 16 day composite with NDVI and EVI. For this lab exercise, the date has been taken between May to October which is growing season.

Figure 1. Study area from year 2000
Additionally, to use this stack file in the Terraset, we must apply scale factor by using bandmath equation 'fix(b1*10000)' with unsign 16-bit.
Make a z-profile of each 2000,2005 and 2015 band.


Figure 5. Z-profile for 2000

Figure 6. Z-profile for 2005

Figure 7. Z-profile for 2015
The main two limitations of NDVI band ratio would be dense vegetation and bare soil at the sparse vegetation area. Soil in sparse vegetation may give you inaccurate NDVI value. Dense vegetation such as forest might give you inaccurate NDVI value because it can be overestimated by high canopy and high biomass.
USING MODIS TIME SERIES DATA TO MONITOR NDVI CHANGES
Introduction:
The remotely sensed data is very significant resource to monitor the changing phenomena in the Earth. Particularly in vegetation detection, MODIS is proper satellite to use. By using MODIS's imagery, it is able to capture the wide range of the area in a short amount of time. MODIS has high temporal resolution with low spatial resolution and in this lab, we are more focusing on how the vegetation grows over time therefore, MODIS's imagery is good to use. To monitor the trend in large area, it is good to zoom-out our sight rather than zoom-in. Discovering the vegetation growing specifically, browning and greening, it might be able to interpret whether the area has been impacted by climate change or anthropogenic events such as population increase, construction and making unsustainable environmental policies. In this exercise, we will going to use mean NDVI during the vegetation season, according to the years between 2000 to 2016 to see whether it is greening or browning.Data & Study area:
The data that has been used for this lad exercise is the MODIS imagery which acquired from 2000 - 2017. The study area has been placed on part of Wisconsin and Minnesota.The data was downloaded from NASA website and within the package of MODIS data, we used MOD13C1 which delineate 16 day composite with NDVI and EVI. For this lab exercise, the date has been taken between May to October which is growing season.

Figure 1. Study area from year 2000
Methodology:
First, we need to download the image from NASA website (https://urs.earthdata.nasa.gov/) and save it in your working folder. Now you begin the ENVI. Once you open the file you have downloaded, we stack NDVI of each year in to one file. After that, we need to transform the value of mean NDVI in law data using by bandmath equation 'S1*0.0001' to get the value range 0 to 1 which is NDVI value stands for. Once we are done with that, we need to calculate the mean NDVI for each year growing season. In order to do that, you need to use bandmath tool agian and type it as 'float((b1+b2+b3+b4+b5)/5)'.
Assume that we made successfully, we now need to remove the negative NDVI value by using mask tool. Therefore, we convert NDVI time series to unsigned integer and pixel with no data will be shown as 0 value.
Assume that we made successfully, we now need to remove the negative NDVI value by using mask tool. Therefore, we convert NDVI time series to unsigned integer and pixel with no data will be shown as 0 value.
Additionally, to use this stack file in the Terraset, we must apply scale factor by using bandmath equation 'fix(b1*10000)' with unsign 16-bit.
Make a z-profile of each 2000,2005 and 2015 band.
Results:
I used pixel locator tool to navigate the location of 43.806262N, -91.210492E. The red line represents the band and as we know we sat the band as year, it represents the year.

Figure 2. Z-profile for 2000

Figure 3. Z-profile for 2005

Figure 4. Z-profile for 2015


Figure 6. Z-profile for 2005
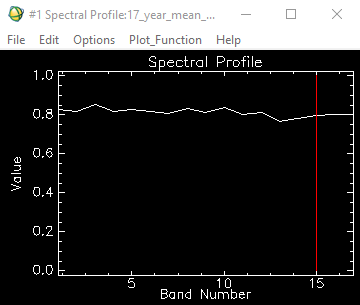
Figure 7. Z-profile for 2015
Discussion:
According to the results I have gotten, the Z-profile shows the trend of browning and greening based on the 16 given years. The positive trend represents the greening and negative trend represents browning. Once I have done analysis, I could see the browning trend at year between 2012 and 2013. other than that, overall trends were sustainable at the NDVI value 0.8, thus I can say the greening vegetation is dominant in the area.The main two limitations of NDVI band ratio would be dense vegetation and bare soil at the sparse vegetation area. Soil in sparse vegetation may give you inaccurate NDVI value. Dense vegetation such as forest might give you inaccurate NDVI value because it can be overestimated by high canopy and high biomass.
Conclusion:
Overall thought of this lab is very impressive. Using satellite image and convert to NDVI to see the whether greening or Browning is very useful to detect the environmental problem. We can assume that some of the factors that would have affected to this trend in bio-physically and perhaps by anthropogenic events. For the bio-physical event, it would be climatic event such as rainfall and there would be construction and population increase of human that might have impacted dramatically to the greening vegetation.
Comments
Post a Comment