Laboratory_4
Lab_4
CONVERSION OF DN TO REFLECTANCE AND ATMOSPHERIC CORRECTION OF IMAGERY ACQUIRED BY LANDSAT 5 THEMATIC MAPPER
Introduction:
People use satellite imagery in many different ways. Typically for Geospatial Analysts, satellite imagery can be valuable resource to analyze and detect the land use and land cover. As we know nature is very dynamic and unpredictable therefore, there might be some obstacles and considerations that Geospatial Analysts should be recognized. Raw imagery that is acquired from satellite is consist with pixel and its DN(Digital Number) and its value should be converted to reflectance value which is very convenience to analysts. They use reflectance value rather than DN value because, reflectance value contains more spectral information and logical understandings. Analysts are also asked to consider atmospheric correction. Because of the many diverse atmospheric conditions, there would be some obstacles such as scattering and transmission.(Figure.1) In this lab, I would like to introduce how to convert from DN to radiance and radiance to reflectance. additionally I will do some of atmospheric correction to get surface reflectance which is our ultimate goal.


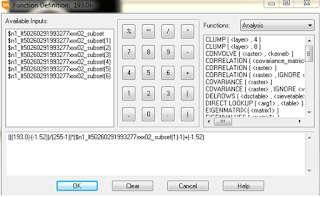

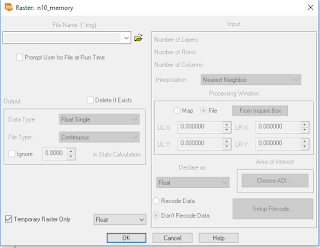
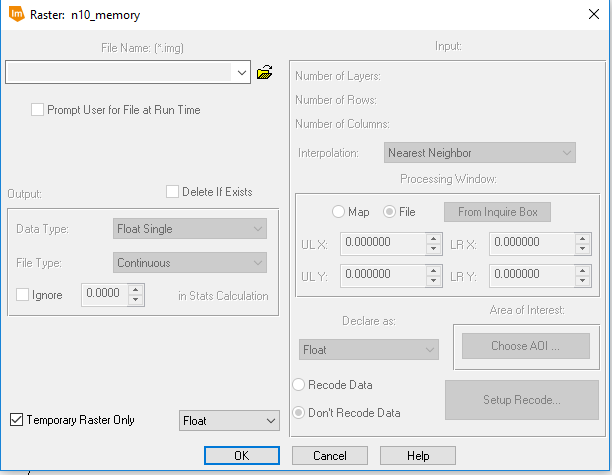
Figure 4. Temporary raster

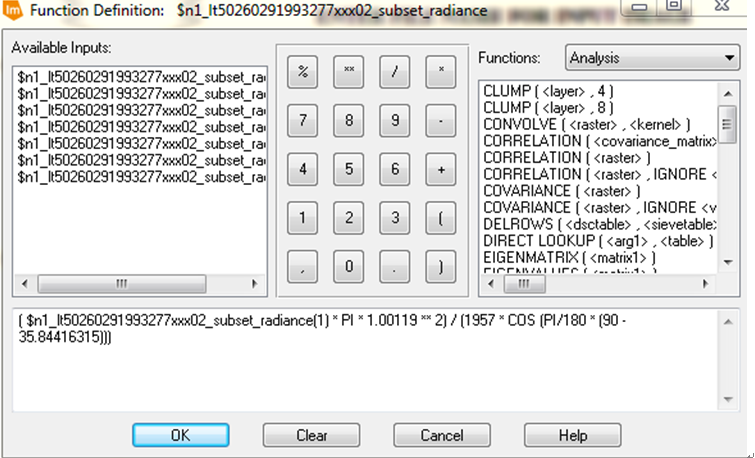
Now we need to find TOA reflectance according to given equation

Figure 6. Radiance to reflectance equation


Figure 11. Atmospheric Correction process
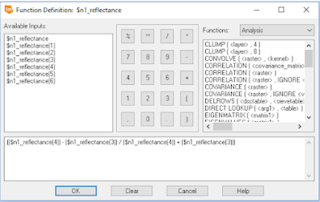

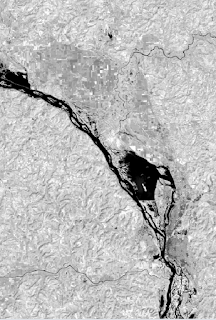


Figure 1. Atmospheric scattering and transmission
Objectives:
After this lab,
- We should be able to understand radiance and irradiance.
- We should be able to how the satellite imagery has been made.
- We should be able to know what is reflectance and
- We should be able to know difference between TOA relfectance and surface reflectance
- We should be able to know calculation of NDVI
- We should be able to know difference between DN, TOA reflectance and surface relfectance that have been applied by NDVI calculation.
Study Area and data:
- La Crosse County, WI
- Landset 5 TM Imagery
- Bands : Blue, Green, Red, NIR, SWIR1,SWIR2
- Spatial resolution: 30m
Methods:
- Open ERDAS IMAGINE
- Open the raster layer
- Select the file named, 'lt50260291993277xxx02_subset.img'
- Go to tool section and click the "Model maker"
Figure 2. ERDAS IMAGINE model maker
- Input 'lt50260291993277xxx02_subset.img' as input function
- Input the equation to process function
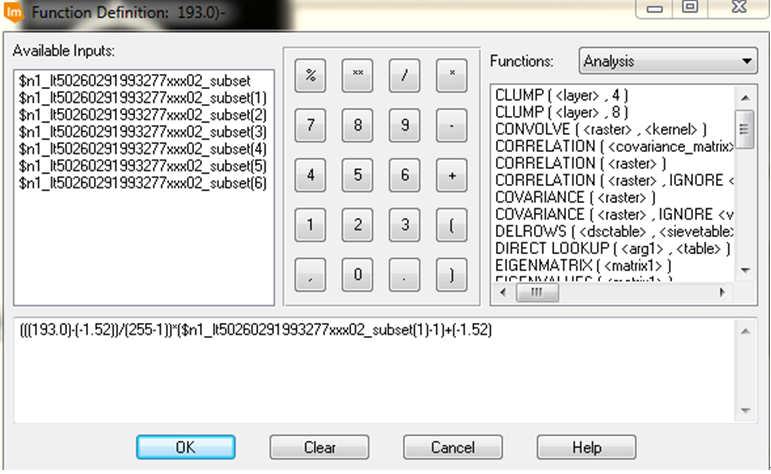
Figure 3. DN to Radiance

- Apply this equation to each 6 bands (we don't count thermal band)
- Make temporary raster function.
- Add function for STACKLAYERS apply each bands (Figure 5.)
- Add output function and save it as radiance.img

Figure 5. DN to radiance model

Figure 6. Radiance to reflectance equation
- In this case we use either or statement. This gives you value 0 when it is negative and keep the value with positive.

Figure 7. either or function
- save it as TOA reflectance and this how the final model should look like

Figure 8. radiance to TOA reflectance
- Same as before, add temporal raster function to each bands and stack them together.
- Once we got the TOA reflectance, we should find surface reflectance which is much useful data to us. (It is reflectance which is less affected by atmospheric conditions)
- To do that, we need to use given conversion model called "COST"
- Change the value there from metadata of raw data which you have been given

Figure 9. COST model

Figure 10. Metadata of raw data
- After you find the values, referring to previous TOA reflectance model, you only need to chance the first input data and process model of each band by given equation below.

Figure 11. Atmospheric Correction process
- Apply same this to each bands
- After that, you will get "Surface reflectance" from output.
- Finally, as we know we are analyzing land use and land cover, we want to use NDVI to enhance our result.
- Based on the models and values that we have calculated, such as TOA reflectance , surface reflectance and DN, we are going to apply NDVI calculation and compare those values.

Figure 12. NDVI calculation
Discussion:
After I found reflectances that were applied by NDVI, we open those outputs and do need to pick some random pixel to compare the result.

Figure 13. DN_NDVI

Figure 14. TOA reflectance _ NDVI

Figure 15. Surface reflectance_ NDVI

Figure 16. NDVI value table
Conclusion:
Based on the values that I have gotten, the result moderately trends which procedure were more accurate and preferable . For the DN_NDVI and TOA reflectance NDVI, both of them have similar value. However, for the surface reflectance it has higher value than those other two procedures.
This is somewhat obvious because, surface reflectance had been through atmospheric correction of scattering and transmission. The value with TOA reflectance tends to be lower because the amounts of reflectance that should've been detecting by sensor, might be cut off by scattering and diffusing.
Comments
Post a Comment