Laboratory_3
Lab_3
Study Area:
Data:


Discussion:


Figure.11 Improved Grassland : SWIR1 >50
Bog/Heah : Mean NDVI < 0.5
Water : NDVI<= 0.01

Figure.12 Given thresholds + Not vegetation : Mean NDVI <= 0.1
Bog/Heah : Mean NDVI <0.9
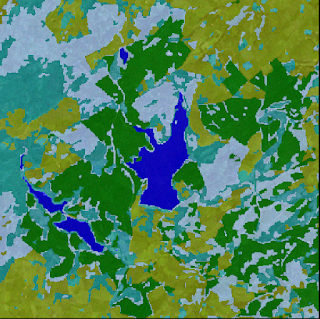
Figure.13 Given thresholds + Not vegetation : Mean NIR <= 0.1
Mean SWIR1 <= 0.1
Theses additional thresholds enabled me to have more accurate classification. The main role were Mean of NDVI, SWIR and NIR. According to basic knowledge of remote sensing based band type, NIR is significant for the vegetation detection and also SWIR is effective to see the soil existence. NDVI is vegetation index, therefore never enough to say it is important.

Figure.14 Given thresholds + Water : Area <= 10000 pix
Not vegetation <=10 pix
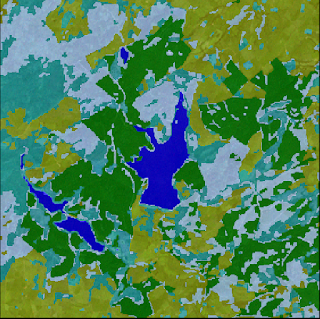
Figure.15 Given thresholds + Forest : Mode SWIR1 <=50

Figure.16 Given thresholds + Acid Semi Improved Grassland : Brightness intensity <50
Improved Grassland : Brightness intensity <=50
First, I would like to say it is not easy to use different feature applications to improve your classification map. However, more feature thresholds may increases the accuracy of your classification result. I have used different feature as area, mode and brightness intensity. For area feature, I applied to water and not vegetation and gave them threshold to see other classes more clearly. For the mode of SWIR1, I could see no different than mean feature. For the Brightness intensity, I expected to see more classified Grassland area accordingly to put <50 value, because land has lower brightness than water.
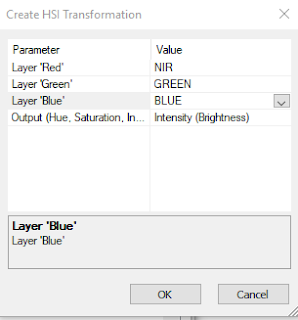
Figure.17 Brightness Intensity feature window
Conclusion:
In conclusion, as I always say, this E-cognition program is very friendly and easy method than any other remote sensing tools. In this lab, this Rule Based Classification is very easy and convenience to use. Further more, it was very good tool for more accurate analysis.
RULE BASED CLASSIFICATION
Introduction:
For the previous lab, we have obtained the skill called “Nearest-Neighbor
rule based classification”. This was very useful technic for Object based image
analysis, however, in E-cognition program, there is another rule based
classification that we can apply by adjusting and compiling the class
hierarchy. In this method, we can actually assign the thresholds to each of
class we have. This is very useful when
you have significant knowledge of remote sensing because, the amounts of you
manipulate the features, we will be able to get accurate and effective result.
In this Lab3, we will use Landsat 7 subset imagery from North Wales.
Study Area:
- Llyn Brenig in the Denbigh Moors, North Wales, United Kingdom
- 15m resolution PAN
- 30m resolution BLUE, GREEN, RED, NIR, SWIR1, SWIR2
Objectives:
- · We should be able to know how to create rule based classification.
- · We should be able to know how the apply the threshold to different classes.
- · We should be able to know class hierarchy in the classification process.
- · We should be able to know difference between absolute and fuzzy thresholds.
- · We should be able to know how to customize NDVI feature
- · We should be able to know how the NDVI effect the vegetation and what kinds of band ratio relationship is preferable to classification.
Rule-Based Classification Thresholds
There are two types of thresholds that we can apply to each
classes. “Absolute threshold” and “fuzzy thresholds”. First, absolute threshold
is mostly used because, it is simple break value and easy to use. For example,
<30,>25 and =100
This kinds of threshold enables users to refine and
filtering the pixel values by parameter you have assign. However, in real
world, for example, one grass classified pixel doesn’t mean 100% of grass. It may
have grass with rock and soil. In that case, we use different threshold called “Fuzzy
threshold”. As I mention this, fuzzy is
not perfect shape value that we can calculate but it gives you much more
accurate result. If you want analyze specific land cover land use, this
threshold is the one you go for.
Method:
- E-cognition
- create new project
- Insert Panchromatic imagery first and B, G, R, NIR, SWIR1, SWIR2
- Make a subset imagery

Figure.1 Project Parameters
- Customize mean NDVI feature
Figure.2 Arithmetic Feature Window
- Create a "Class Hierarchy"
Figure.3 Class Hierarchy window
- Create "Rule Based classification" to each classes by clicking class → contained → insert expression → insert threshold


Figure.4 Insert new expression window
- Insert the given following input
Figure.5 Thresholds inputs
- Make a Rule based Classification Example in Process Tree
- Insert child' Multi resolution segmentation

Figure.6 Segmentation parameter window
- Create a classification, Merge and export
- Export into Arc GIS
- Make a map with map elements
- Apply different parameter and thresholds
- Try to make better classification
Discussion:

Figure.7 Classified Land Cover map of North Wales, UK
Based on the exported map, we are able to see the little errors compared with the original Landsat 7 image. some of the water pixels are classified as not vegetation. According to the thresholds that we focus on the vegetation, the forest and Grassland are well classified.

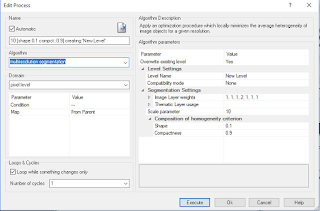
Figure.8 Parameter with scale 5

Figure.9 Parameter with scale 40

Figure.10 Parameter with compactness 0.9
After several trials of different parameter in segmentation, scale with 5 has caused salt and pepper effect. I could see more Acid Semi Improved Grassland in the Bog/Heah class as well as Improved Grassland. It seems like detecting more details in small area.
In order hand, parameter with scale 40 was too much. In comparison, this was visually better than scale 5, but less accuracy. For the compactness of 0.9, the classified areas looks like very rigid because it was over weighted.

Bog/Heah : Mean NDVI < 0.5
Water : NDVI<= 0.01

Figure.12 Given thresholds + Not vegetation : Mean NDVI <= 0.1
Bog/Heah : Mean NDVI <0.9
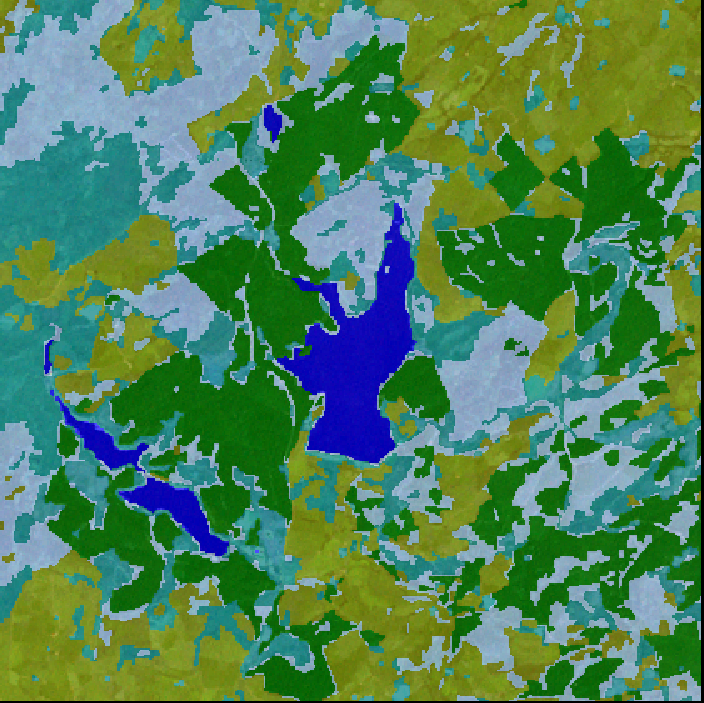
Figure.13 Given thresholds + Not vegetation : Mean NIR <= 0.1
Mean SWIR1 <= 0.1
Theses additional thresholds enabled me to have more accurate classification. The main role were Mean of NDVI, SWIR and NIR. According to basic knowledge of remote sensing based band type, NIR is significant for the vegetation detection and also SWIR is effective to see the soil existence. NDVI is vegetation index, therefore never enough to say it is important.

Figure.14 Given thresholds + Water : Area <= 10000 pix
Not vegetation <=10 pix

Figure.15 Given thresholds + Forest : Mode SWIR1 <=50

Figure.16 Given thresholds + Acid Semi Improved Grassland : Brightness intensity <50
Improved Grassland : Brightness intensity <=50
First, I would like to say it is not easy to use different feature applications to improve your classification map. However, more feature thresholds may increases the accuracy of your classification result. I have used different feature as area, mode and brightness intensity. For area feature, I applied to water and not vegetation and gave them threshold to see other classes more clearly. For the mode of SWIR1, I could see no different than mean feature. For the Brightness intensity, I expected to see more classified Grassland area accordingly to put <50 value, because land has lower brightness than water.

Figure.17 Brightness Intensity feature window
Conclusion:
In conclusion, as I always say, this E-cognition program is very friendly and easy method than any other remote sensing tools. In this lab, this Rule Based Classification is very easy and convenience to use. Further more, it was very good tool for more accurate analysis.
Comments
Post a Comment